chipify

Chipify


(c) 2026 Santiago Hofwimmer BSc
Institute for Integrated Circuits and Quantum Computing, Johannes Kepler University (JKU), Linz, Austria
Link to Youtube Channel (tutorials following soon)
[!WARNING] This repository is a Work in Progress.
[!IMPORTANT] It is recomended to use the IIC-OSIC-TOOLS container. Otherwise, you have to install Ngspice, Xschem and IHP-Open-PDK manually as prerequisites.
[!IMPORTANT] Currently, only the IHP-Open-PDK is fully supported, but more will follow soon
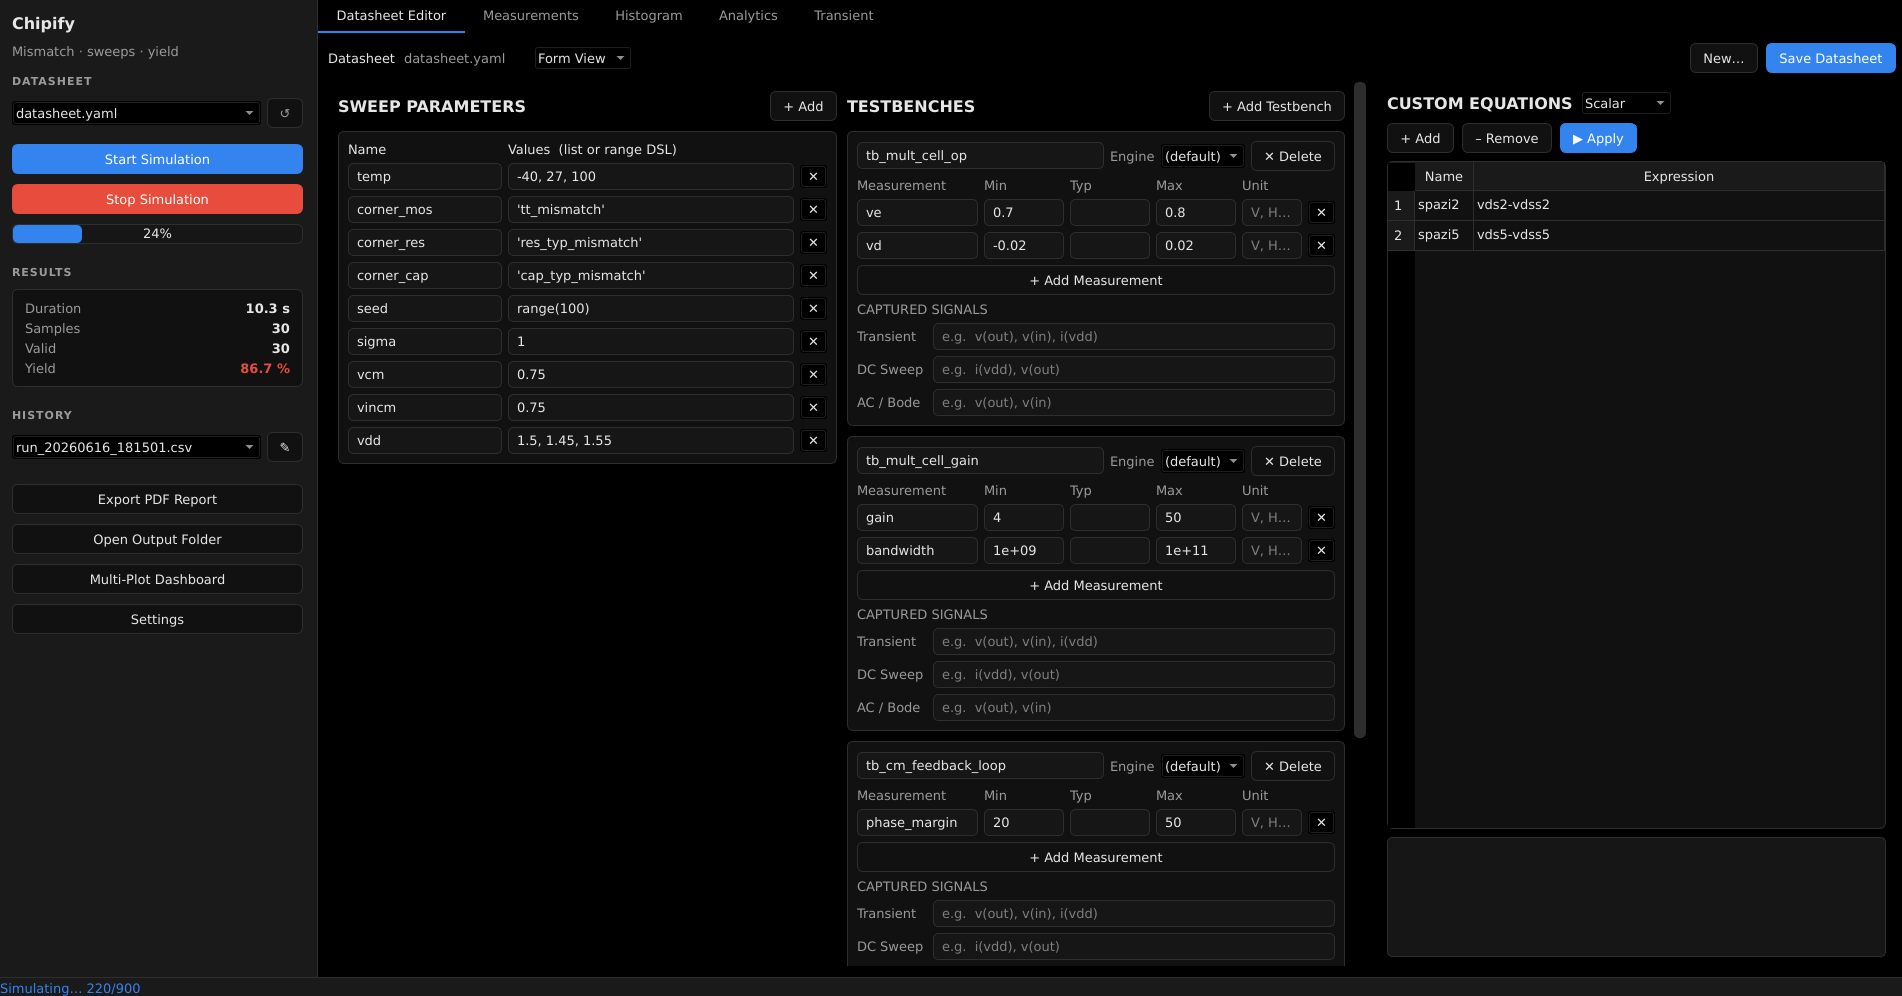
Chipify is a high-performance EDA (Electronic Design Automation) tool for mismatch simulations, parameter sweeping, and yield analysis. It wraps Xschem (schematic capture) and Ngspice (circuit simulation) to automate Monte-Carlo and corner sweeps, run them in parallel, and turn the raw results into plots, yield matrices, and reports.
It ships with both a PySide6 (Qt) desktop GUI and a headless CLI, plus a plugin system for custom plots, reports, and expressions.
Features
- Parallel sweeps — multiprocessing pool runs Monte-Carlo / corner cases across all cores.
- Datasheet-driven — describe parameters, tests, and pass/fail specs in a single YAML file.
- Range DSL —
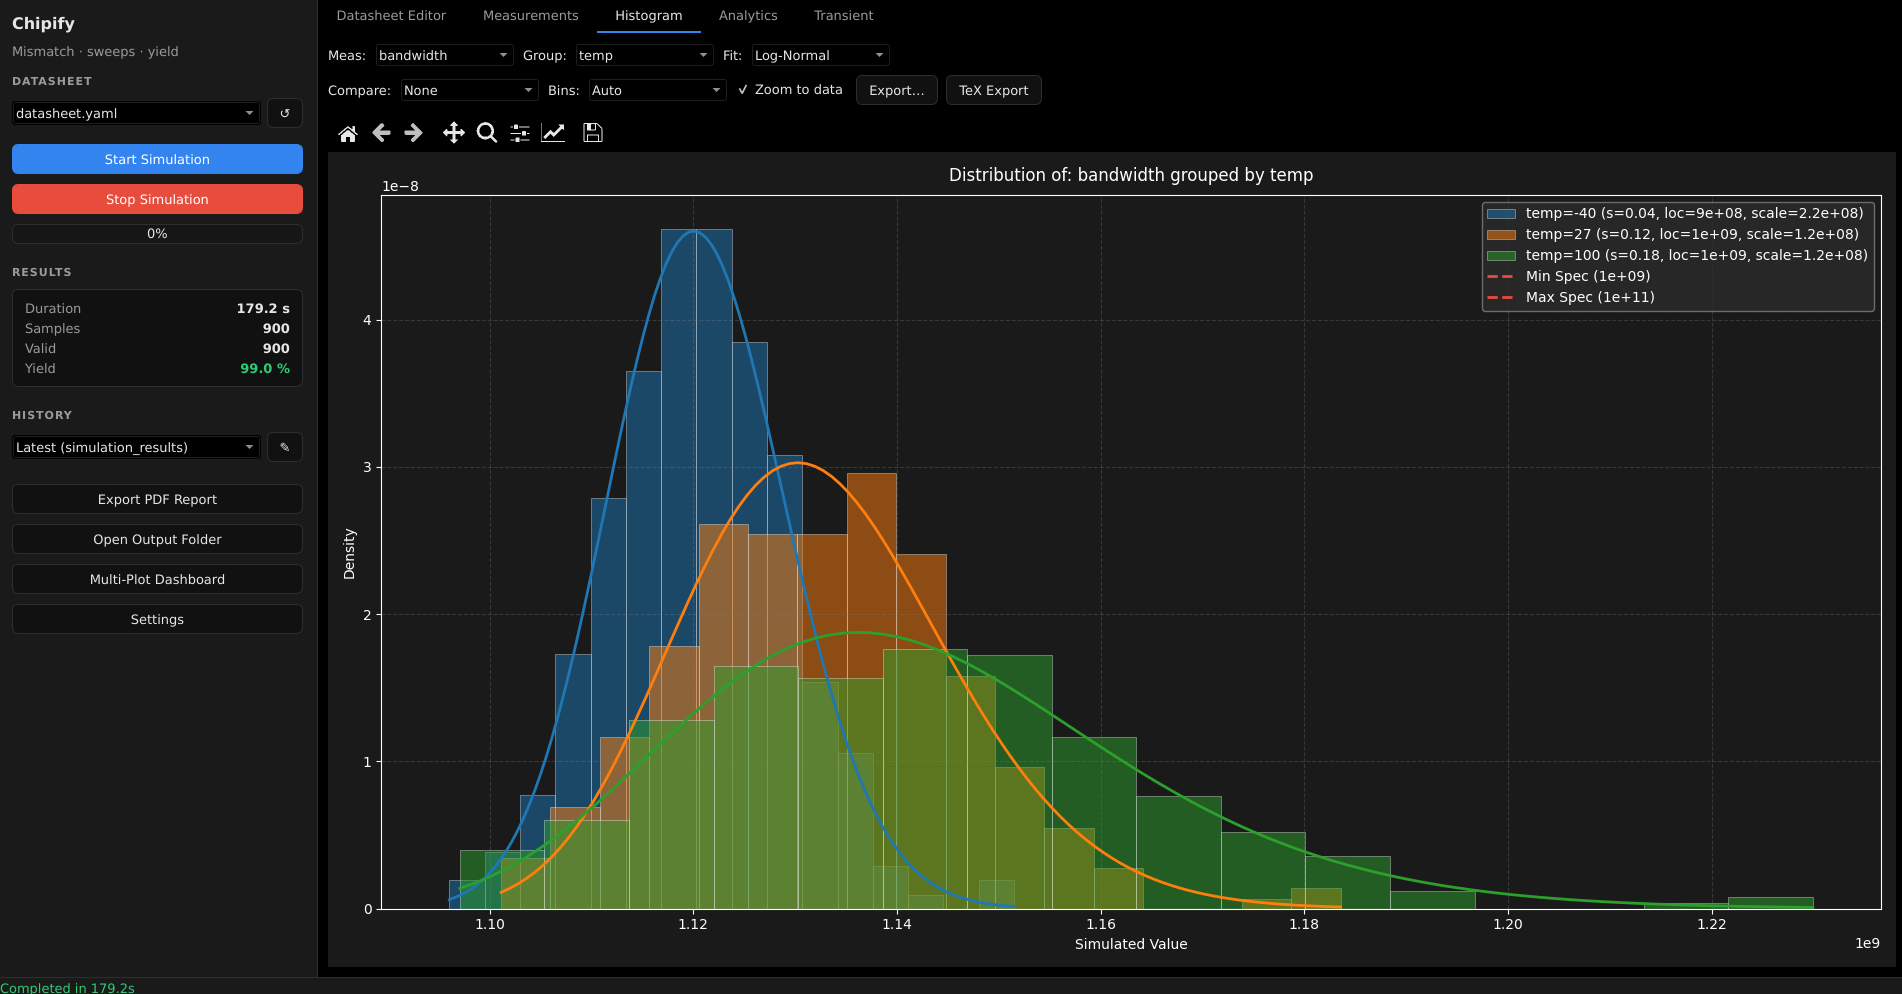
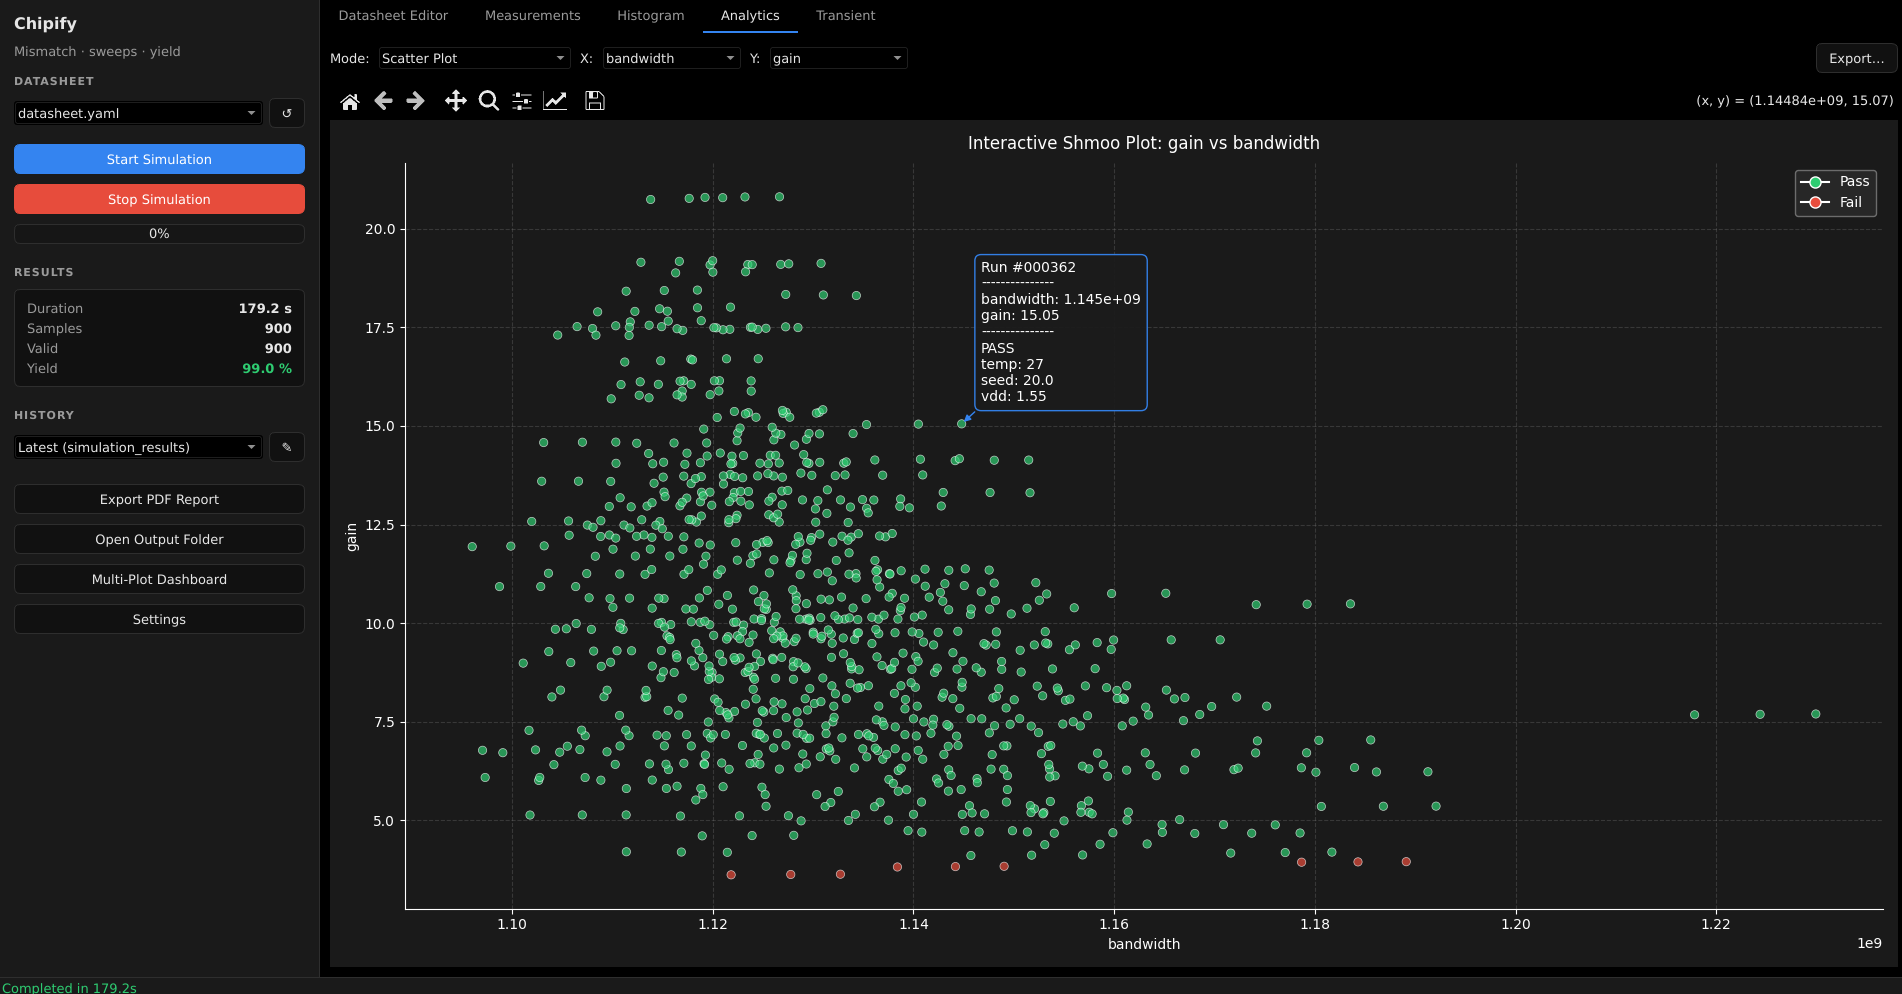
range,linspace, andlogspaceparameter sweeps (safely parsed, noeval). - Yield & statistics — pass/fail yield, histograms with distribution fits, corner yield matrices.
- Safe custom expressions — derive new metrics with a sandboxed evaluator (no arbitrary code execution).
- Reports — export to PDF, Markdown, and LaTeX; PNG/SVG plot exporters.
- Pluggable — add your own plots, reports, expressions, and exporters (see PLUGINS.md).
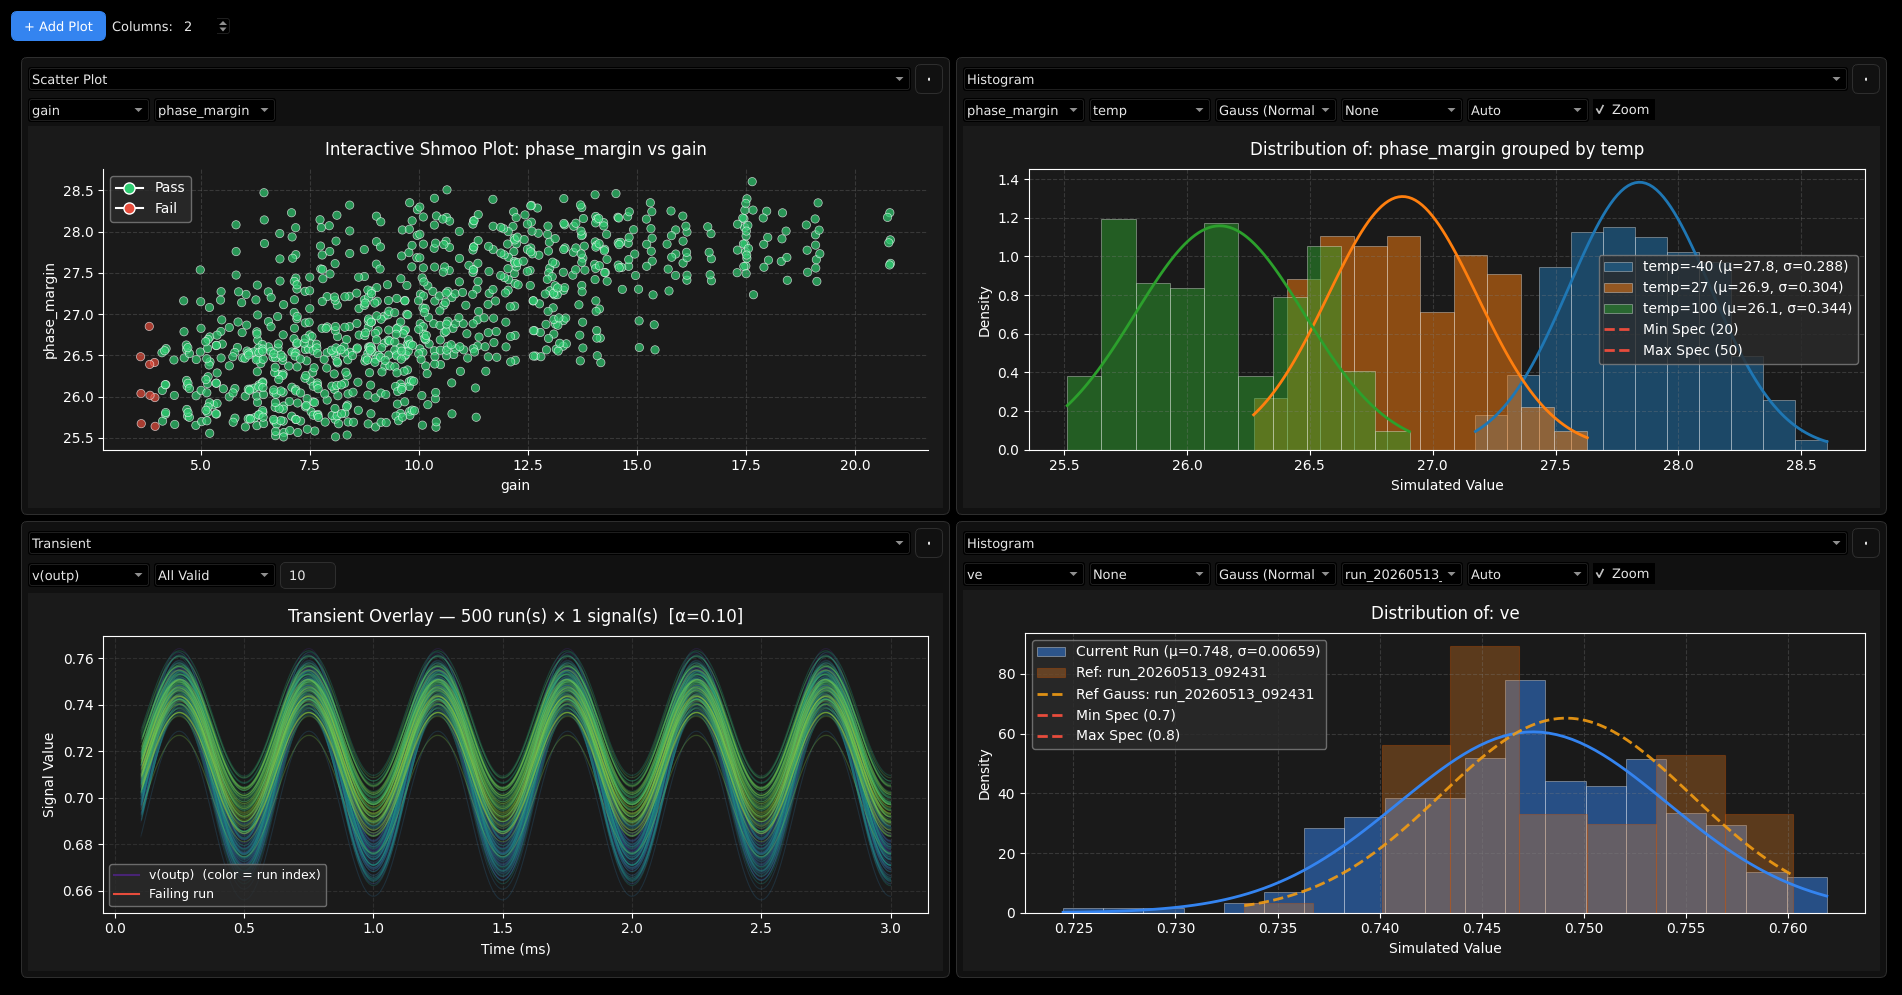
- Multi Plot Dashboard - arrange a selection of plots on a second window.
Prerequisites
Chipify is a wrapper around external EDA tools, so these must be installed and
available on your PATH:
- Python 3.11+
- Ngspice — the SPICE simulator
- Xschem — schematic capture / netlist generation
- (optional) VACASK + PyOPUS — alternative simulation backend
- (Linux) PySide6 system libraries — the Qt GUI runs on
PySide6-Essentials(installed automatically by pip; only QtCore/QtGui/QtWidgets are used, so the larger PySide6 Addons aren’t needed). Qt still needs a few shared libraries that pip can’t install:libegl1/libgl1(libEGL.so.1/libGL.so.1) are dlopened when Qt is imported — required even for the headless test suite. Without them you getImportError: libEGL.so.1: cannot open shared object file.libxcb-cursor0(Qt ≥ 6.5) is needed by thexcb/XWayland platform for the on-screen GUI; without it a Wayland session falls back to native Wayland, where dropdown menus don’t close on selection.
install.shinstalls all of these automatically on Debian/Ubuntu; elsewhere install them with your package manager (e.g.apt install libegl1 libgl1 libxcb-cursor0). System libraries can’t be declared insetup.py/pyproject.toml, so they’re handled byinstall.sh.
It is highly recommended to install and run Chipify inside the IIC-OSIC-TOOLS docker container. This way, all the required tools plus a bunch of open source PDKs are already installed.
Installation
python3 -m pip install chipify
Quick start
Desktop GUI
chipify
This opens the desktop application where you can edit datasheets, launch sweeps, and explore results interactively.
Headless CLI
See examples/datasheet.yaml for a documented
datasheet template (and examples/README.md for how to run
it). Place your datasheet YAML in the input folder (datasheets/ by default), then:
chipify-cli -c my_design.yaml          # run a single datasheet
chipify-cli -c my_design.yaml --reports  # ...and write what its reports: block asks for
chipify-cli --batch ./datasheets       # run every *.yaml in a directory
chipify-cli --batch ./datasheets --reports      # ...plus one combined PDF for all of them
chipify-cli --batch ./datasheets --report-only  # rebuild the reports from finished runs
chipify-cli -c my_design.yaml --json   # also print a JSON summary (handy for CI)
chipify-cli -c my_design.yaml --markdown report.md
Results are written to the output folder (out/ by default), including
simulation_results.csv and any generated reports. Every run is also kept in
history/ with a .meta.json sidecar recording what produced it (chipify
version, the datasheet’s hash and a copy of it, the settings and engines used).
Run chipify-cli --help for the full list of options.
In batch mode each datasheet gets its own folder, out/<datasheet>/ (results,
history/, waveforms in analysis_data/, reports/). With --reports the batch
also writes one combined PDF, out/reports/<timestamp>/batch_report_<timestamp>.pdf:
a summary page with one row per datasheet (runs, valid, passed, yield, time,
start page), each datasheet’s description: and its failing measurements,
followed by every datasheet’s own report, with one bookmark per datasheet.
--report-only rebuilds all of this from each datasheet’s newest finished run
without simulating, for example after editing the reports: blocks.
Settings can be changed for one invocation without editing settings.json,
for example on a compute server:
chipify-cli --batch ./datasheets --only 'corners_*'   # just some datasheets (repeatable)
chipify-cli --batch ./datasheets --cores 8 --timeout 3600 --out /scratch/run1
--only matches a datasheet’s file name or stem, shell-style and case-sensitive;
the combined report then covers the selection. --cores and --timeout replace
num_cores and sim_timeout_sec (seconds per simulation) for this run, and
--out replaces the output folder, chipify.log included. A run keeps the
settings it started with: editing settings.json while it runs does not change it.
Before a long sweep
chipify-cli -c my_design.yaml --preflight      # check it; simulates nothing
chipify-cli -c my_design.yaml --case 12        # simulate case 12 only
chipify-cli --batch ./datasheets --case 0      # smoke test: case 0 of every datasheet
--preflight loads and validates each datasheet, counts its cases, resolves
each testbench’s engine, generates every netlist (missing schematics, symbols
and include files show up here) and renders the first case, which catches a
misspelled parameter in a testbench. Its exit code is 1 when anything would
fail. --case K simulates the single case with run id K (000012 for 12) with
the run’s settings and keeps, in out/debug/<datasheet>/case_<id>/, each
testbench’s deck exactly as the simulator got it, the simulator’s log and the
captured waveforms; during a sweep these only exist as scratch files that the
next case overwrites. Neither writes anything to history/.
Interrupted runs
A run keeps every case it finishes, as it goes, in
history/run_<ts>.rows.jsonl. If it is stopped, crashes, is killed (out of
memory, a container stop, the host going to standby), the finished cases stay
there, and the same command with --resume simulates only the rest:
chipify-cli -c my_design.yaml --resume
The run continues with its own netlists (archived when it started) and its own
settings; --cores and --timeout given with --resume still apply, for
example a longer timeout for the cases that timed out. It is refused if the
datasheet changed since the run started, and only the datasheet’s newest run
can be continued. A run stopped in the GUI can be continued this way too.
A batch keeps a record of how far it got (out/batches/batch_<ts>.json).
chipify-cli --batch ./datasheets --resume continues the newest batch of that
folder if it was cut short: datasheets that had finished are loaded, not
simulated again (they still appear in the summary and the combined report),
the interrupted one resumes its run, and the rest start. A batch that ran to
the end is not resumed; rerun its failed datasheets with --only.
A datasheet’s optional one-line description: (top-level key, also editable in
the GUI’s Datasheet Editor) appears on its report cover and on the summary
page. An optional project.yaml in the project root sets the batch report’s
title (name) and subtitle (description), and datasheet_order sets the
order (by default, by file name; unlisted files follow in that order):
name: bandgap
description: Chipify characterization report, IHP SG13CMOS5L, ngspice-47
datasheet_order: [corners_op.yaml, corners_tc.yaml, corners_ac.yaml]
Configuration
User preferences are stored in settings.json in the directory you launch
Chipify from (CPU cores, simulator engine, theme, live plotting, …). The file
is created/updated by the GUI’s settings dialog. Custom equations live in the
datasheet YAML (equations: / transient_equations:), not in settings.json.
Folder paths
By default Chipify uses this layout under the working directory:
| Folder | settings.json key |
Default |
|---|---|---|
| Input datasheets | in_dir |
datasheets/ |
| Simulation output | out_dir |
out/ |
Model files (*.lib/*.mod/*.inc staged for simulation) |
work_dir |
work/ |
| Testbench files | tb_dir |
tb/ |
To relocate any of them, set the corresponding key in settings.json to an
absolute or relative path, e.g.:
{
  "out_dir": "results",
  "in_dir": "/data/chipify/datasheets"
}
Any key that is missing or blank falls back to its default. Paths are resolved when Chipify starts, so changes take effect on the next launch.
Importing SPICE netlists (skip schematic entry)
By default each testbench netlists an Xschem schematic (tb/<name>.sch) for you.
If you don’t use schematic entry, set the optional per-testbench source: netlist
key — Chipify then loads an existing SPICE deck for that testbench directly and
skips Xschem. The deck is located by convention, next to where the schematic
would live: tb/<name>.spice for ngspice, tb/<name>.sim for vacask.
tests:
  gain_tb:                # loads tb/gain_tb.spice instead of tb/gain_tb.sch
    engine: ngspice       # selects the simulator (and the .spice/.sim extension)
    source: netlist       # default is "xschem"
    gain:
      min: 40
      unit: dB
In the desktop GUI this is the per-testbench Source dropdown (xschem /
netlist). The engine: key still chooses the simulator. Downstream everything
is unchanged — parameter sweeps, measurement capture, pass/fail specs, and
reports all work exactly as with a schematic.
Authoring an imported netlist:
- Swept parameters are substituted via Jinja2 `` placeholders in
the deck (e.g.
V1 vdd 0). A value that isn’t a placeholder is the same for every sweep point. - The whole deck is rendered as a Jinja2 template, so avoid stray literal
{...}braces (inline expressions like{R*2}) — they raise a template error. Precompute such values in a.control/.paramform that doesn’t use bare braces. - ngspice (managed capture): name your
let/measvectors after the datasheet measurement keys and add your analysis (tran/dc/ac) in a.controlblock. Do not hand-writeecho MY_DATA:/wrdatalines — Chipify injects those from the datasheet, just as it does for Xschem output. - vacask: provide a
.simdeck that writes a.rawconsistent with the Spectre path; Chipify extracts scalars/waveforms from the.rawfile (and anymeasure:expressions) in the datasheet. - Model files referenced via
.include/.libcan be given three ways:- a bare filename (
.include models.lib) — put the file inwork/(*.lib/*.mod/*.incare staged into the scratch dir automatically); - a relative path (
.include ../macros/amp.spice) — resolved against the directory of the testbench itself, and baked into the deck as an absolute path before it runs. If the file isn’t there, that testbench fails with an error naming the path and the directory searched; the rest of the sweep still runs; - an absolute path — used as-is.
The same applies to
include/ahdl_include/loadin a vacask.simdeck. Chipify runs the deck from a scratch dir, not fromtb/, which is why the relative paths have to be resolved up front. - a bare filename (
Re-running against pre-generated templates (the --templates-dir flag) still
takes precedence over a per-testbench source: netlist.
Running the examples
The examples for chipify can be found here
Project layout
chipify/            # engine (no GUI-toolkit deps)
  cli.py            # CLI entry point + GUI launcher
  simulator.py      # multiprocessing simulation engine
  schema.py         # datasheet validation + range DSL
  expression.py     # sandboxed expression evaluation
  settings.py       # project folder paths (configurable via settings.json)
  app_config.py     # persistent preferences + logging
  data_loader.py    # results loading / pass-fail / history (shared, headless)
  uikit/            # toolkit-agnostic GUI-support layer (state, services, plugin facade)
  gui_qt/           # PySide6 (Qt) desktop GUI (tabs / controllers / workers / widgets)
tests/              # pytest suite for the core engine + GUI smoke tests
See context.md for the full architecture overview and PLUGINS.md for the plugin API.
Development
pip install -e .
pytest                                   # run the test suite
python -m mypy chipify/settings.py       # strict type-checking (see pyproject.toml)
License
Licensed under the Apache License 2.0.